Homechevron rightBlogchevron right
Core Web Vitals Assessment Failed: How to Fix Common Core Web Vitals Issues in 2025

Core Web Vitals Assessment Failed: How to Fix Common Core Web Vitals Issues in 2025

Web Development
Updated 
February 18, 2025
24 min read
Author:
Dasha Efimova
Dasha Efimova
Chief Editor
Core Web Vitals Assessment Failed: How to Fix Common Core Web Vitals Issues in 2025

If your business website just failed Google’s Core Web Vitals (CWV) assessment, you’re not alone, but you’re right to be concerned. 

In 2025, Core Web Vitals remain a major SEO ranking factor and a critical user experience (UX) benchmark. A failing grade means slower load times, poor interactivity and unstable layouts, all of which drive away visitors, hurt conversions and sink your rankings in search results.

The image of a failed Core Web Vitals assessment
The image of a failed Core Web Vitals assessment that scares website owners

Google’s standards for performance and usability are tougher than ever, but the good news is that most CWV issues can be fixed with the right approach. 

Whether you’re battling slow page speeds, unresponsive elements or layout shifts that frustrate users, this guide will help you diagnose and resolve the most common Core Web Vitals issues based on our SEO practices.

In this post, we’ll break down:

✅ What to do with your Core Web Vitals assessment failed

✅ The most common CWV issues in 2025 (and how to detect them)

✅ Actionable fixes for improving Largest Contentful Paint (LCP), Interaction to Next Paint (INP) and Cumulative Layout Shift (CLS)

✅ Tools & strategies to ensure your website passes the CWV assessment

✅ How Webflow is natively geared for stellar Core Web Vitals metrics, and how you can further enhance this

Let’s get your website back on track, boost your rankings and keep your visitors engaged. Here’s how to fix Core Web Vitals issues in 2025.

What Are Core Web Vitals?

Core Web Vitals are a set of performance metrics defined by Google to measure real-world user experience on websites. 

They focus on three key aspects: loading speed, interactivity and visual stability. If your website performs poorly in these areas, visitors are more likely to leave, leading to higher bounce rates, lower conversions and reduced organic search rankings, let alone your chance to generate new business with your website.

Core Web Vitals benchmark scores
Source: NitroPack

Here’s a breakdown of the three Core Web Vitals metrics that matter:

1. Largest Contentful Paint (LCP) Measures Loading Speed

LCP tracks how long it takes for the largest visible element (e.g., a hero image, featured video, or main heading) to fully render.

  • Good: ≤ 2.5 seconds
  • Needs improvement: 2.5 – 4.0 seconds
  • Poor: ≥ 4.0 seconds

Common issues that slow down LCP are:

  • Slow server response times
  • Render-blocking JavaScript & CSS
  • Large, unoptimized images
  • Too many third-party scripts

2. Interaction to Next Paint (INP) Measures Interactivity

INP is the new interactivity metric that replaced First Input Delay (FID) in 2024. It measures the overall responsiveness of a page when users interact with it (e.g., clicking a button or typing in a form).

  • Good: ≤ 200ms
  • Needs Improvement: 200 – 500ms
  • Poor: ≥ 500ms

Common issues that hurt INP are:

  • Bloated JavaScript slowing down execution
  • Main thread congestion
  • Poor event listener handling
  • Inefficient third-party scripts

3. Cumulative Layout Shift (CLS) Measures Visual Stability

CLS evaluates how much a page’s elements unexpectedly shift as it loads. If the user scrolls the page and tries to click something but it moves at the last second, that’s a CLS issue.

  • Good: ≤ 0.1
  • Needs Improvement: 0.1 – 0.25
  • Poor: ≥ 0.25

Common causes of CLS issues are:

  • Images, ads or embeds without proper dimensions
  • Dynamically injected content (pop-ups, banners)
  • Web fonts causing “Flash of Unstyled Text” (FOUT)

4. First Contentful Paint (FCP) Measures Initial Load Speed

FCP measures how long it takes for the first visible element (text, image, or background) to appear on the screen. Users need quick visual feedback that the page is loading. A slow FCP makes a site feel unresponsive.

  • Good: ≤ 1.8 seconds
  • Needs Improvement: 1.8 – 3.0 seconds
  • Poor: ≥ 3.0 seconds

Common causes of issues with FCP are:

  • Render-blocking JavaScript & CSS
  • No critical CSS optimization
  • Large & unoptimized images
  • Slow external fonts & missing preloads
  • Too many third-party scripts (ads, analytics, trackers)

5. Time to First Byte (TTFB) Measures Server Response Speed

TTFB measures how long it takes for a browser to receive the first byte of data from the server. A slow TTFB delays everything else – LCP, FCP and user interactions.

  • Good: ≤ 800ms
  • Needs Improvement: 800 – 1,800ms
  • Poor: ≥ 1,800ms

Common issues delaying TTFB are:

  • Slow web hosting & server performance
  • No content delivery network (CDN)
  • Unoptimized database & slow queries
  • Lack of server-side caching
  • High number of redirects

Why Is Passing Core Web Vitals Important?

Failing your Core Web Vitals (CWV) assessment isn’t just a technical issue. It directly impacts your website’s search rankings, user experience and conversions. Google prioritizes sites that offer fast, responsive and stable experiences, so if your website doesn’t meet these benchmarks, you’re likely losing traffic, engagement and revenue.

Here’s why passing Core Web Vitals is crucial in 2025:

Higher Google search rankings (SEO impact)

In short: A fast, well-optimized website gives you a competitive edge in SEO, reducing dependency on paid ads.

Google made Core Web Vitals an official ranking factor in its Page Experience update. Websites that pass CWV tend to rank higher in search results, leading to increased organic traffic and visibility. On the flip side, failing CWV can push your site below competitors, making it harder for potential customers to find you.

Better user experience & engagement

In short: If visitors get frustrated waiting for content to load or dealing with sudden page shifts, they’ll leave (possibly for a competitor’s site).

Core Web Vitals are user-centric metrics, meaning they measure real-world experience rather than just technical performance.

A site that loads fast (LCP), responds instantly (INP) and stays visually stable (CLS) ensures users can navigate smoothly without frustration. Poor CWV metrics lead to higher bounce rates, lower engagement and fewer conversions.

Increased conversions & revenue

In short: If your Core Web Vitals scores are poor, you’re potentially losing customers before they even get a chance to interact with your product or service.

Website performance directly affects conversion rates. Studies show 40% of visitors will leave a website if it takes longer than 3 seconds to load. Mobile users' greater impatience means that they might leave your websites even faster. Whether you’re running a B2B SaaS site, an ecommerce store or a service-based business, slow, unresponsive websites lead to lost revenue.

Reduced ad costs & improved paid campaigns

In short: Optimizing CWV can lower acquisition costs and improve ad performance, making your paid campaigns more effective.

If you rely on Google Ads, CWV impacts your Quality Score, which affects ad rankings and cost-per-click (CPC). Poor page experience can lead to higher ad costs and lower ad effectiveness, making your marketing spend less efficient.

Why Your Core Web Vitals Assessment Failed

If your website shows that Core Web Vitals failed, it means that real-world users are experiencing slow load times, unresponsive interactions or unstable page layouts. 

Google evaluates CWV based on field data from real users (not just lab tests), meaning a failing score reflects actual visitor frustrations. 

Here’s what it means when your website fails the CWV assessment:

🔴 Your Website’s Performance Is Below Google’s Standards

Google categorizes CWV results into three levels:

  • Pass: All three metrics meet Google’s performance thresholds.
  • Needs Improvement: Some metrics are close but don’t fully meet the standards.
  • Fail: One or more Core Web Vitals metrics fall into the "Poor" range.

A failing score suggests your site takes too long to load, is slow to respond to user actions, or has elements shifting unexpectedly, all of which degrade the experience.

🔴 You’re at Risk of Lower Search Rankings

Google uses Core Web Vitals as a ranking factor, so a failing assessment can negatively impact your SEO performance. If your competitors have better CWV scores, they may rank higher in search results, even if your content is superior.

A failing CWV score could lead to lower organic visibility, fewer visitors and decreased conversions.

🔴 Users Are More Likely to Leave Your Site (Higher Bounce Rates)

A failing CWV score means your site frustrates users, leading them to abandon the page before engaging with your content or making a purchase.

  • Slow loading times (LCP, FCP and TTFB issues) cause visitors to leave before seeing important content.
  • Delayed interactivity (INP issues) makes users feel like the site is broken.
  • Shifting layouts (CLS issues) cause misclicks and confusion, reducing trust.

A failing CWV assessment often correlates with higher bounce rates, lower engagement and lost sales opportunities.

🔴 Paid Campaigns May Suffer and Add Up Ad Costs

If you rely on Google Ads, a poor CWV score can negatively impact your Quality Score, leading to higher cost-per-click (CPC) and lower ad effectiveness.

Your ad spend becomes less efficient, forcing you to pay more for the same traffic.

Looking at the Core Web Vitals Report

The Core Web Vitals Report in Google Search Console provides a structured breakdown of your website’s performance based on real-world user data collected from the Chrome User Experience Report (CrUX) as well as Google’s lab data based on Google Lighthouse and PageSpeed Insights. 

Here’s a top-to-bottom overview of how the Core Web Vitals Report is structured:

1. Core Web Vitals Dashboard (Overview Page)

Go to Google Search Console → Experience → Core Web Vitals

The dashboard provides a high-level summary of your website’s CWV performance, categorized into mobile and desktop reports. It classifies URLs into three status groups:

  • Good: All Core Web Vitals metrics meet Google’s thresholds.
  • Needs Improvement: One or more metrics are close but require optimization.
  • Poor: One or more metrics fail to meet Google’s performance standards.

The dashboard highlights the number of affected URLs, helping you prioritize fixes.

The Core Web Vitals overview dashboard

2. Mobile and Desktop Reports

Mobile and desktop users have different browsing experiences. Many sites pass CWV on desktop but fail on mobile due to network speeds, smaller screens, and lower device processing power.

Each report separately evaluates:

  • Mobile performance, typically more challenging due to bandwidth constraints.
  • Desktop performance , often better, but still crucial for rankings and UX.
Mobile and desktop reports in Core Web Vitals

3. Metric-Specific Breakdown (LCP, INP, CLS, FCP, TTFB)

You can access metric-specific Core Web Vitals assessment data using PageSpeed Insights (PSI). 

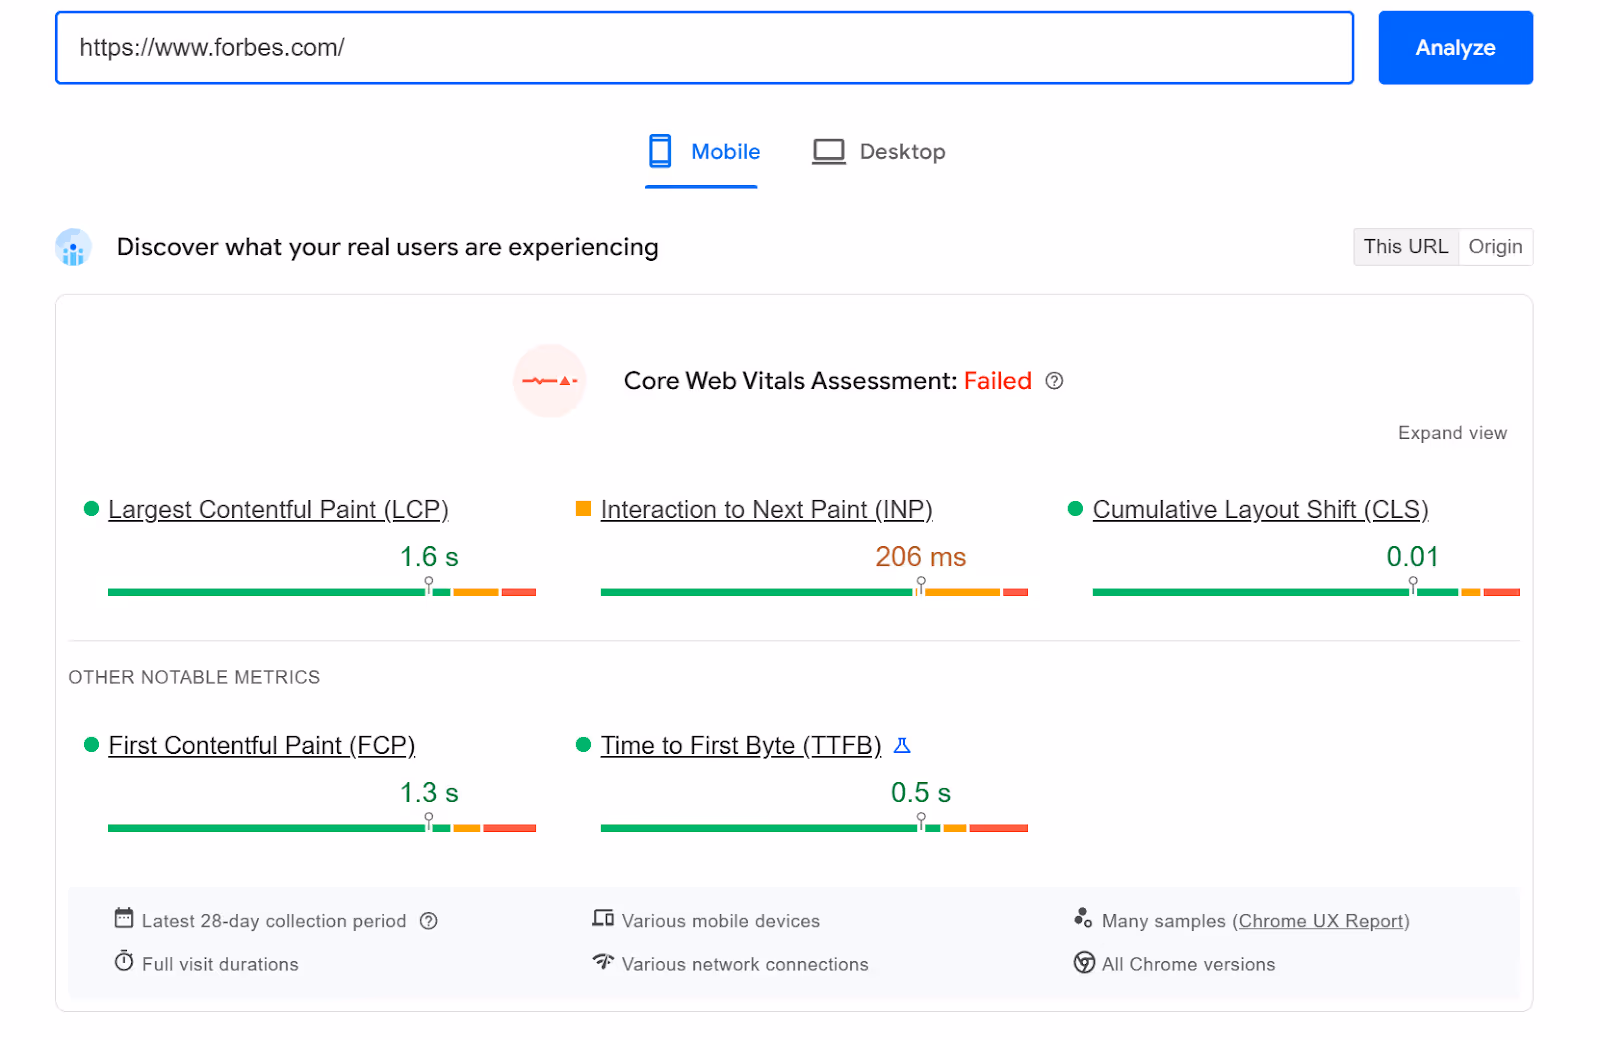
Google PageSpeed Insights provides a detailed Core Web Vitals report that evaluates real-world (field) data and simulated (lab) data to help diagnose performance issues on web pages. The structure of the report includes multiple sections that analyze loading speed, interactivity, visual stability and opportunities for improvement.

The first part of the report presents an overall performance summary. This includes a high-level assessment of how well a page performs based on real-world user data and a simulated lab test. The summary shows whether the page passes or fails the Core Web Vitals assessment. If enough data is available from the Chrome User Experience Report, PSI displays metrics collected from actual visitors over the past 28 days. If there is insufficient real-world data, the report relies solely on lab data.

If any of the CWV metrics fall into the "needs improvement" or "poor" categories, the page fails the assessment.

Core Web Vitals failed based on field data
Core Web Vitals performance score for forbes.com based on lab data

Next, the diagnostics section highlights technical issues affecting website performance per each of the failed metrics. This section provides insights into factors such as JavaScript execution time, the number of third-party scripts, inefficient CSS rules and excessive DOM elements. Addressing these issues can lead to more efficient page rendering and helping fix a poor user experience.

Diagnostics section of the Core Web Vitals report

Next, the accessibility section evaluates how well a website accommodates users with disabilities or impairments. It follows Web Content Accessibility Guidelines (WCAG) to assess whether elements on the page are accessible to users who rely on assistive technologies such as screen readers.

Accessibility score in the Core Web Vitals report

It’s followed by the Best Practices section that assesses how well a website follows modern web development best practices, focusing on security, performance and browser compatibility. The report identifies potential vulnerabilities or outdated technologies that could affect user experience or pose security risks.

Best Practices score in the Core Web Vitals report

Next is the SEO section that analyzes how well a website is optimized for search engines. This assessment focuses on technical SEO factors that affect a site’s visibility in search engine results. While PSI does not provide a full SEO audit, it covers foundational elements that impact discoverability and ranking.

SEO score in the Core Web Vitals report

Each of the sections listed above also contain the list of passed audits, helping you to see where your website successfully meets the requirements.

Getting to know the different sections of the PageSpeed Insights Core Web Vitals report gives website owners and developers a clear roadmap to fine-tune performance, fix bottlenecks and create a smoother, faster user experience. Test your pages with PSI, and you can stay ahead of potential issues, keep your site loading quickly and ensure everything feels seamless and stable. 

Field Data vs. Lab Data: What’s the Difference?

When measuring Core Web Vitals, performance reports use two types of data: field data and lab data. 

Field data is collected from real users visiting your website in the wild, using different devices, internet connections and geographic locations. It comes from the Chrome User Experience Report (CrUX).

Lab data is collected from a controlled test environment, not real users. It simulates how a webpage loads on a specific device, network speed and location using tools like Lighthouse and PageSpeed Insights.

Feature Field Data (Real Users) Lab Data (Simulated Tests)
Source Chrome User Experience Report (CrUX) Lighthouse, PageSpeed Insights
Used for SEO? ✅ Yes (Google ranks based on this) ❌ No (not part of rankings)
Real User Conditions? ✅ Yes ❌ No (simulated environment)
Shows Historical Trends? ✅ Yes (collected over time) ❌ No (single test result)
Helps Debug Issues? ❌ No (only shows affected URLs) ✅ Yes (detailed performance breakdown)
Instant Feedback? ❌ No (data updates periodically) ✅ Yes (immediate test results)

Core Web Vitals: The Most Common Issues (and How to Fix Them)

If your website fails the Core Web Vitals assessment, it means one or more of the CWV metrics are not meeting Google's performance benchmarks. Below, we’ll break down the most common issues causing failure and the solutions that fixing your Core Web Vitals involves.

A list of CWV diagnostic recommendations

Slow Load Times (LCP Issues) – Pages Take Too Long to Load

What’s happening?

  • The largest visible element (image, heading, video, or hero section) takes too long to load.
  • Slow server response times and render-blocking scripts delay the page.
  • Unoptimized images and large media files make the page heavier.

Here’s how to fix it:

Optimize images & media:

  • Use modern image formats like WebP or AVIF instead of JPEG/PNG.
  • Implement lazy loading for below-the-fold images.
  • Use responsive images for different screen sizes.

Reduce server response time (TTFB):

  • Use a fast hosting provider or a CDN (Cloudflare, Fastly, or Akamai) to serve content faster.
  • Optimize backend performance by caching static assets and using efficient database queries.

Eliminate render-blocking resources:

  • Minify and defer CSS and JavaScript using tools like WP Rocket or Autoptimize.
  • Use async/defer attributes to load JavaScript only when needed.

Enable compression & browser caching:

  • Use Gzip or Brotli to compress assets.
  • Set long cache expiration times for static files.

Poor Interactivity (Core Web Vitals INP issues detected) – Slow Response to User Actions

What’s happening?

  • Users experience delays when clicking buttons, opening menus or filling out forms.
  • Heavy JavaScript execution clogs the main thread, making the site feel laggy.
  • Third-party scripts (ads, analytics, tracking pixels) slow down responsiveness.

Here’s how to fix it:

Reduce JavaScript execution time:

  • Minimize unused JavaScript.
  • Use lazy loading to defer scripts that aren’t immediately needed.
  • Use web workers to offload heavy computations.

Optimize event listeners & reduce main thread work:

  • Avoid using expensive JavaScript event listeners on every scroll or click.
  • Use passive event listeners to improve scroll performance.

Remove or delay third-party scripts:

  • Reduce third-party tracking scripts, chat widgets, and unnecessary fonts.
  • Load third-party scripts using Google Tag Manager’s asynchronous loading.

Use a faster JavaScript framework (if applicable):

  • If using React/Vue, leverage server-side rendering (SSR) or hydration optimization.

Layout Shifts (CLS Issues) – Elements Move Unexpectedly

What’s happening?

  • Content jumps or shifts as the page loads, causing misclicks and user frustration.
  • Images, ads or iframes load without set dimensions, causing reflows.
  • Web fonts cause “Flash of Unstyled Text” (FOUT), shifting content as fonts load.

Here’s how to fix it:

Set explicit width & height for optimizing images, ads and embeds:

  • Define width and height attributes for all images and videos.
  • Use CSS aspect ratio boxes for responsive media.

Avoid injecting dynamic content above the fold:

  • Place ads, banners and pop-ups below the fold to prevent sudden layout shifts.
  • If using dynamic elements, reserve space in advance.

Use a font loading API or system fonts:

  • Consider using system fonts (Arial, Helvetica, etc.) instead of custom fonts.

Poor Mobile Optimization – Different CWV Scores for Mobile vs. Desktop

What’s happening?

  • Your site passes CWV on desktop but fails on mobile due to slower networks.
  • Heavy scripts, large images and unoptimized CSS make mobile pages sluggish.
  • Mobile users experience longer load times and more layout shifts.

Here’s how to fix it:

Enable responsive image delivery:

  • Use srcset to serve smaller images on mobile devices.
  • Implement adaptive image resizing through a CDN (e.g., Cloudflare, Imgix).

Prioritize mobile performance:

  • Use AMP (Accelerated Mobile Pages) if applicable.
  • Optimize critical CSS and load only essential resources on mobile.
  • Reduce DOM size and avoid unnecessary animations on mobile.

Optimize for slow network speeds:

  • Use Service Workers to cache content offline.
  • Enable Progressive Web App (PWA) features for better mobile UX.

Hosting & Infrastructure Issues – Server Delays & Poor Caching

What’s happening?

  • Your server takes too long to respond, causing poor Time to First Byte (TTFB).
  • Pages reload slowly because caching and compression are not enabled.
  • The site lacks a Content Delivery Network (CDN), making it slower for global visitors.

Here’s how to fix it:

Upgrade hosting & use a CDN:

  • Choose a high-performance web host (e.g., Vercel, Cloudways, Kinsta).
  • Use a CDN (Cloudflare, AWS CloudFront, Fastly) to serve static content faster.

Leverage browser caching & Gzip compression:

  • Set long-term cache expiration headers for static files.
  • Enable Gzip or Brotli compression to reduce file sizes.

Optimize database queries & server logic:

  • Minimize slow API calls and optimize database queries.
  • Use server-side caching solutions (Redis, Varnish, or WP Rocket for WordPress sites).

Optimizing Core Web Vitals on Webflow

Webflow is a powerful no-code platform that naturally aligns with Google’s Core Web Vitals principles. Unlike traditional website builders or legacy CMS platforms like WordPress, Webflow is built with performance-first architecture, ensuring faster load times, better interactivity and stable layouts.

However, it can still require optimization to pass the Core Web Vitals assessment. While Webflow provides clean HTML and CSS, performance issues can arise due to large media files, excessive animations and third-party integrations.

How Webflow Is Geared for Successful Core Web Vitals by Design

Unlike platforms that require heavy plugins or third-party optimizations, Webflow automatically includes several built-in performance features that help sites pass CWV:

  • Global CDN (Fastly and Amazon CloudFront CDNs) that reduces server response times (TTFB) and improves Largest Contentful Paint (LCP).
  • Automatic lazy loading for images and videos, which improves LCP by prioritizing above-the-fold content first.
  • Optimized asset delivery and compression that minifies HTML, CSS and JavaScript to reduce page weight.
  • Minified code and optimized hosting that removes unnecessary render-blocking scripts, improving INP (responsiveness).
  • Responsive and adaptive design without bloat, meaning elements scale efficiently without unnecessary reflows (improving CLS).
  • No excessive third-party plugins as Webflow has built-in features for forms, animations, SEO settings and CMS, reducing third-party dependencies.
  • Preloading & async loading of scripts that prevents blocking page rendering.
  • Built-in schema & meta data controls, so developers can easily add structured data (schema markup) for better indexing.
  • No-code animations that don’t block rendering, unlike jQuery-based effects in WordPress or Shopify.
  • Efficient font management so CLS (Cumulative Layout Shift) is reduced by embedding font styles properly.
  • Custom code controls for developers who can manually adjust render priorities, lazy load assets and async scripts.

With all of the above, it still makes sense to take specific steps to optimize your Webflow website for ‘good’ CWV scores.

Improving LCP (Largest Contentful Paint) in Webflow

Goal: Reduce load time for the largest visible element on the page.

✅ Optimize hero sections & background images:

  • Use WebP format instead of PNG/JPEG for faster loading.
  • Set background images in CSS instead of inline to improve render speed.
  • Avoid using large SVG files as hero images. Convert them to PNG or WebP instead.

✅ Use Webflow’s built-in image optimization:

  • Webflow automatically compresses and resizes images, but you should manually resize images that are very large before uploading.
  • Enable responsive images in Webflow (it automatically generates different image file sizes).

✅ Minimize render-blocking resources:

  • Remove unnecessary custom code, third-party scripts and large embeds.
  • Defer non-critical JavaScript.

Reducing INP (Interaction to Next Paint) Delays in Webflow

Goal: Ensure the site responds quickly to user interactions like clicks and inputs.

✅ Minimize heavy JavaScript & third-party scripts:

  • Avoid excessive third-party widgets (e.g., chatbots, analytics, ads).
  • If using Google Tag Manager, load non-essential scripts after page load.
  • Use async or defer for custom scripts.

✅ Limit complex Webflow interactions & animations:

  • Use Webflow’s animation settings to reduce easing on animations (faster transitions).
  • Use “while scrolling” animations sparingly as they can cause delays.

✅ Optimize forms & input fields:

  • Avoid placing too many forms above the fold.
  • Use native Webflow forms instead of third-party form embeds (e.g., Typeform or HubSpot forms).
  • Reduce unnecessary validation scripts running on every keystroke.

Fixing CLS (Cumulative Layout Shift) in Webflow

Goal: Prevent unexpected layout shifts caused by images, fonts or dynamic content.

✅ Set explicit width and height for images and videos:

  • Webflow automatically resizes images, but you should still set fixed image dimensions.
  • Use the Webflow aspect ratio setting instead of height auto-adjustment.
  • Ensure iframes, embedded content and ads have fixed dimensions.

✅ Preload web fonts to prevent FOUT (Flash of Unstyled Text)

  • Use Webflow’s custom font settings to preload important fonts.

✅ Avoid adding dynamic elements above the fold

  • Pop-ups, banners and dynamic sections shouldn’t push the page’s main content down.
  • If using Webflow’s CMS collections, ensure they load below the fold to prevent shifts.

General Webflow Performance Optimization Tips

✅ Enable Webflow's minify settings: 

  • Go to Webflow → Site Settings → Publishing → Minify HTML, CSS, JS.

✅ Use Webflow’s asset manager efficiently:

  • Remove unused images and assets to avoid extra server requests.
  • Compress images before uploading to Webflow.

✅ Reduce unused CSS & classes:

  • Webflow automatically generates classes, leading to bloated CSS.
  • Regularly audit and delete unused classes using Webflow’s Style Manager.

✅ Use Webflow’s built-in lazy loading:

  • Webflow automatically lazy loads images, but check that videos and embeds also load only when needed.

✅ Reduce page complexity & DOM size:

  • Keep Webflow containers and elements structured efficiently.
  • Avoid deeply nested divs that increase rendering time.

Webflow’s Built-In Tools for Testing & Improving CWV

Webflow makes it easy to diagnose and fix Core Web Vitals issues with native tools such as:

Webflow’s Audit panel

It identifies unused CSS classes, unoptimized images and layout shifts, and helps improve CLS by refining layout structures.

Google Lighthouse integration

Webflow supports Lighthouse-based testing, allowing developers to analyze page performance directly in Chrome DevTools.

Live PageSpeed Insights testing

Webflow sites can be tested with Google’s PageSpeed Insights, and since Webflow follows Google’s performance best practices, it’s easier to pass CWV compared to WordPress or Shopify.

Direct control over hosting performance

Unlike WordPress shared hosting, Webflow sites run on AWS and Fastly infrastructure, meaning higher uptime, lower latency and better TTFB (Time to First Byte).

Which CMS Is Better for Core Web Vitals?

When choosing a content management system (CMS), performance should be a top priority. A fast, well-optimized CMS helps ensure better page speed, interactivity and layout stability, leading to higher engagement and conversions.

Below is a detailed comparison of Webflow, Squarespace, WordPress, Contentful and Wix, focusing on their CWV performance, flexibility and ease of optimization.

CMS Comparison: Core Web Vitals Performance

CMS LCP (Load Speed) INP (Interactivity) CLS (Layout Stability) Customization Overall CWV Score
Webflow ✅ Fast (Optimized CDN, no bloat) ✅ Fast (Minified JS, async scripts) ✅ Stable (No excessive theme shifts) ✅ High (Custom code, structured CSS) ⭐⭐⭐⭐⭐
Squarespace ⚠️ Moderate (Heavy themes, slow TTFB) ❌ Slow (Excessive JS, limited script control) ⚠️ Moderate (Dynamic elements cause shifts) ❌ Low (Limited customization) ⭐⭐
WordPress ⚠️ Varies (Needs caching & CDN plugins) ⚠️ Moderate (JS bloat, plugin conflicts) ❌ Poor (Layout shifts due to themes/plugins) ✅ High (Highly customizable, but requires technical skills) ⭐⭐⭐
Contentful ✅ Fast (Headless CMS, uses external frontend) ✅ Fast (Optimized API calls) ✅ Stable (Custom layout control) ✅ High (Requires dev expertise) ⭐⭐⭐⭐⭐
Wix ❌ Slow (Heavy inline JavaScript, limited optimizations) ❌ Slow (Code bloat, long INP delays) ❌ Poor (Widgets and dynamic elements shift page layout) ❌ Low (Drag-and-drop system limits flexibility)

Core Web Vitals Tools to use

Optimizing Core Web Vitals requires the right set of tools to analyze performance, diagnose issues and track improvements over time. From real-world user data to in-depth performance audits, these free tools provide valuable insights to help websites pass the Core Web Vitals assessment and improve SEO, user experience and conversions.

Google Search Console

Google Search Console Core Web Vitals

Google Search Console (GSC) provides an official Core Web Vitals report based on real user data from the Chrome User Experience Report (CrUX). This report categorizes pages as Good, Needs Improvement, or Poor based on the three Core Web Vitals metrics: Largest Contentful Paint (LCP), Interaction to Next Paint (INP), and Cumulative Layout Shift (CLS).

  • Monitors Core Web Vitals performance across your entire site.
  • Provides a historical view of CWV trends based on actual user visits.
  • Identifies specific URLs that fail the CWV assessment so you know what to fix.
  • Allows you to validate fixes and request a reassessment from Google.
Poor and need improvement URLs in Google Search Console

Best for:

  • Tracking real-world performance of your website.
  • Identifying pages that need optimization.
  • Measuring the impact of performance improvements over time.

Lighthouse

Google Lighthouse interface
Source: Chrome for developers

Lighthouse is an open-source tool built into Chrome DevTools that runs a simulated test of a webpage in a controlled environment to measure Core Web Vitals. It provides a detailed performance audit covering Core Web Vitals, accessibility, SEO and best practices.

  • Simulates a page load test and provides real-time insights.
  • Highlights render-blocking resources, JavaScript execution delays and slow elements.
  • Provides recommendations to fix Core Web Vitals issues like slow LCP and high CLS.
  • Includes a Performance Score, breaking down where a page is lagging.

Best for:

  • Diagnosing specific performance bottlenecks.
  • Testing page load optimizations before deployment.
  • Running lab-based performance tests when field data is unavailable.
Metric Included in Lighthouse Performance Score
First Contentful Paint (FCP) Yes
Speed Index Yes
Largest Contentful Paint (LCP) Yes
Total Blocking Time (TBT) Yes
Cumulative Layout Shift (CLS) Yes
Interaction to Next Paint (INP) No

PageSpeed Insights

PageSpeed Insights interface

PageSpeed Insights (PSI) is a Google tool that combines real-world Core Web Vitals data with lab-based testing. It analyzes both mobile and desktop performance, providing actionable suggestions to optimize page speed.

  • Uses real user data from the Chrome User Experience Report (CrUX) when available.
  • Runs a Lighthouse audit to simulate page load performance.
  • Provides a detailed breakdown of LCP, INP, CLS, FCP, and TTFB.
  • Suggests specific optimizations, such as reducing JavaScript blocking, image compression and server response improvements.

Best for:

  • Checking Core Web Vitals performance for individual pages.
  • Getting both real-world and simulated performance data.
  • Quick insights into optimization opportunities.

Chrome DevTools

Chrome DevTools is a powerful browser toolset that provides detailed insights into how a webpage loads, interacts, and renders in real time. It allows developers to analyze JavaScript execution, network activity, and layout shifts.

  • Includes the Performance Tab, which visualizes how elements load on the page.
  • Helps diagnose slow LCP by showing the largest element and its load time.
  • Provides a Layout Shift visualization to detect CLS issues.
  • Measures INP responsiveness by tracking event timing.

Best for:

  • Debugging JavaScript execution delays.
  • Identifying render-blocking resources.
  • Running real-time performance tests on different network speeds and devices.

To access Chrome DevTools, open Chrome, right-click on a webpage, select Inspect, then go to Performance Tab, or use the Lighthouse tab within DevTools.

Performance tab in the Chrome DevTools
Lighthouse tab in the Chrome DevTools

Wrapping Up

Optimizing Core Web Vitals isn’t just about passing Google’s assessment. It’s about creating a seamless, fast and frustration-free experience for your users. A website that loads quickly, responds instantly and remains visually stable keeps visitors engaged, reduces bounce rates, and drives more conversions.

From diagnosing issues with Google Search Console, Lighthouse and PageSpeed Insights to fine-tuning server performance, JavaScript execution and image optimization, improving CWV requires a strategic approach. The right tools, techniques and ongoing optimizations will ensure your website stays ahead of performance benchmarks, ranks higher in search results and delivers measurable business impact.

Let’s Fix Your Website’s Performance

At Foursets, we specialize in building high-performance, conversion-driven Webflow websites that pass Core Web Vitals, rank higher in search and deliver better user experiences. Whether you need a performance audit, a website migration or a fully optimized redesign, our team ensures your website meets Google’s speed and UX standards without sacrificing creativity.

GET IN TOUCH

FAQs About Core Web Vitals

1. What are Core Web Vitals, and why do they matter?

Core Web Vitals are a set of performance metrics defined by Google to measure real-world user experience on websites. They focus on three key aspects: Largest Contentful Paint (LCP) for loading speed, Interaction to Next Paint (INP) for responsiveness, and Cumulative Layout Shift (CLS) for visual stability. These metrics impact SEO rankings, user engagement, and conversions, making them essential for website success.

2. How do I check if my website passes Core Web Vitals?

You can check your Core Web Vitals performance using Google Search Console’s Core Web Vitals report, PageSpeed Insights, or Lighthouse in Chrome DevTools. These tools provide a breakdown of field data (real-user experience) and lab data (simulated performance) to identify issues affecting loading speed, interactivity and stability.

3. What happens if my website fails the Core Web Vitals assessment?

If your website has poor Core Web Vitals, it may experience lower search rankings, higher bounce rates and reduced conversions. Google considers Core Web Vitals as a ranking factor, meaning slow or unresponsive sites could be outranked by competitors with better performance scores.

4. How can I improve my Largest Contentful Paint (LCP) score?

To improve LCP:

  • Optimize images by using next-gen formats like WebP or AVIF.
  • Use lazy loading to defer non-essential media.
  • Minimize render-blocking resources like JavaScript and CSS.
  • Improve server response time with caching and a CDN.

5. What are the best ways to fix a poor Interaction to Next Paint (INP) score?

To improve INP:

  • Reduce JavaScript execution time by minifying scripts and deferring non-critical JavaScript.
  • Limit third-party scripts that slow down interactivity.
  • Optimize event listeners to ensure quick response times.
  • Use a fast hosting provider and a CDN to reduce input lag.

6. How do I prevent layout shifts and improve Cumulative Layout Shift (CLS)?

To reduce CLS:

  • Set explicit width and height for images, videos and ads.
  • Avoid injecting dynamic content above the fold without reserving space.
  • Use font-display: swap to prevent text layout shifts.
  • Ensure CSS animations don’t unexpectedly move elements.

7. Can I improve Core Web Vitals on Webflow?

Yes! Webflow is optimized for performance by design, but you can enhance Core Web Vitals by:

  • Using Webflow’s built-in lazy loading for images and videos.
  • Minifying CSS and JavaScript in Webflow’s publishing settings.
  • Preloading critical fonts to prevent layout shifts.
  • Using Webflow’s built-in CDN for faster content delivery.

8. How often should I test my Core Web Vitals?

It’s a good practice to check Core Web Vitals monthly or after making major site changes. Google Search Console updates Core Web Vitals data over a 28-day period, so regular monitoring helps ensure your optimizations are working.

Author:
Dasha Efimova
Dasha Efimova
Chief Editor
Table of contents

Related posts

Explore our blog posts, free design templates, and website improvements for free

Webflow and PayPal Integration
Web Development
12 min read

Webflow and PayPal Integration

Learn the top 3 options to integrate PayPal with Webflow and enable a seamless checkout experience on your Webflow website.

Webflow and Stripe Integration
Web Development
15 min read

Webflow and Stripe Integration

Learn how you can connect Stripe to Webflow using native integration, Stripe Checkout, Stripe Payment Links, Zapier and Memberstack.

Webflow Pricing Explained: How to Choose The Right Plan
Web Development
21 min read

Webflow Pricing Explained: How to Choose The Right Plan

Get the complete Webflow plans and pricing breakdown, along with the tips to choose the right Site and Workspace plan for your business.

Get in touch for a free website proposal

Answer 7 simple questions about your marketing goals and get your free website proposal to skyrocket your growth.